10 simple tips for data visualisation 📊
One thing I’m known for among my clients and colleagues is having “pretty” charts.
While I appreciate the compliment, that’s not my aim.
Our brains process visual information much faster than text. That's why visualising your data in a way that is easy to understand is so important.
Whether you're showing sales numbers or market trends, how you present it can really make a difference.
Today, we'll look at my 10 golden rules for making awesome charts that grab attention and get your point across. Each rule is designed to work with how our brains process information visually.
From keeping things simple to using colours well, we'll show you how to make your data clear and influence your audience.
1. Keep it simple. Display only what you need to make your point. 💬
When it comes to visualising data, simple is always better. A simple chart makes your message clear and easy to understand. When you keep things straightforward, people get what you're saying quickly.
A slide with loads of data and complicated charts just confuses your audience, they spend more time trying to understand your chart and less time understanding the key insight you’re trying to share.
Keeping it simple means sharing only what you need to make your point, it shows you know your stuff and makes you look good.
2. Choose the right chart type. 📊
Different chart types are suited to different types of data and messages. Bar charts are great for comparing categories, while line charts show trends over time.
Selecting the appropriate chart type ensures that your data is presented in the most understandable and visually appealing way possible, maximizing its impact on your audience.
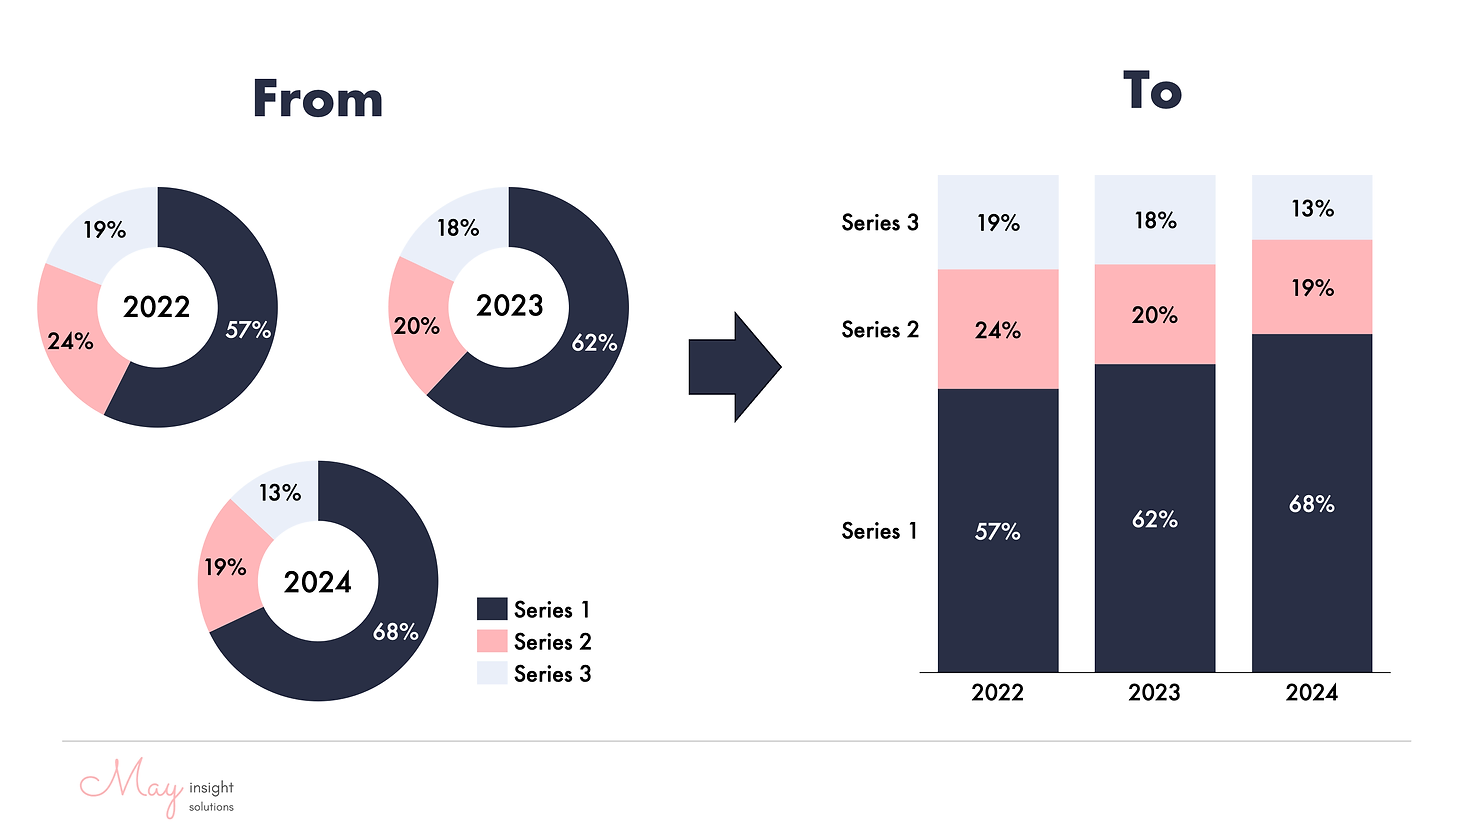
For the love of god, only use pie charts for their one intended use, which is to illustrate the proportions of a whole. A pie chart should always add up to 100%.
If you’re using multiple pie charts to compare proportions, you’re probably better off with a stacked bar chart.
3. Add context where it’s relevant. 💡
Let's say your brand's sales have grown by 5%. That sounds positive, but without context, it's hard to judge if it's good or not. Adding context means comparing your growth to industry benchmarks or competitor performance.
For instance, if the market has grown 3%, your 5% growth suddenly looks even better. Context helps your audience understand the significance of your data and puts it into perspective.

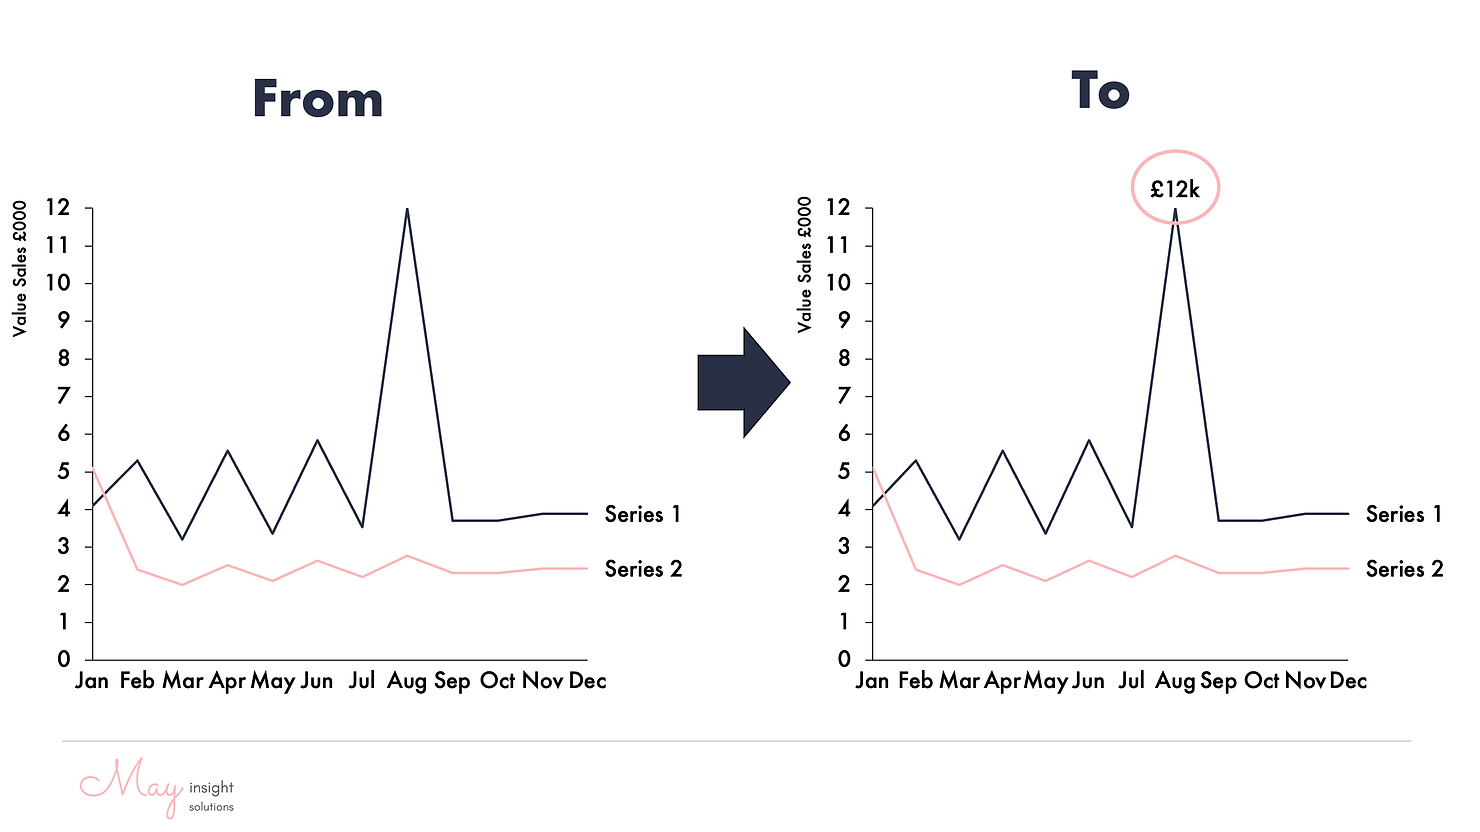
4. Highlight the outstanding. 🏅
Pointing out specific data points helps your audience understand the key insight you’re sharing. When you highlight a data point, you're saying, 'This is important'. It makes it clearer and easier for viewers to grasp why that data matters.
For instance, if you're showing sales over time and there's a sudden spike, highlighting it draws attention, making it obvious it's worth noticing and exploring further. If you can explain the spike, even better!
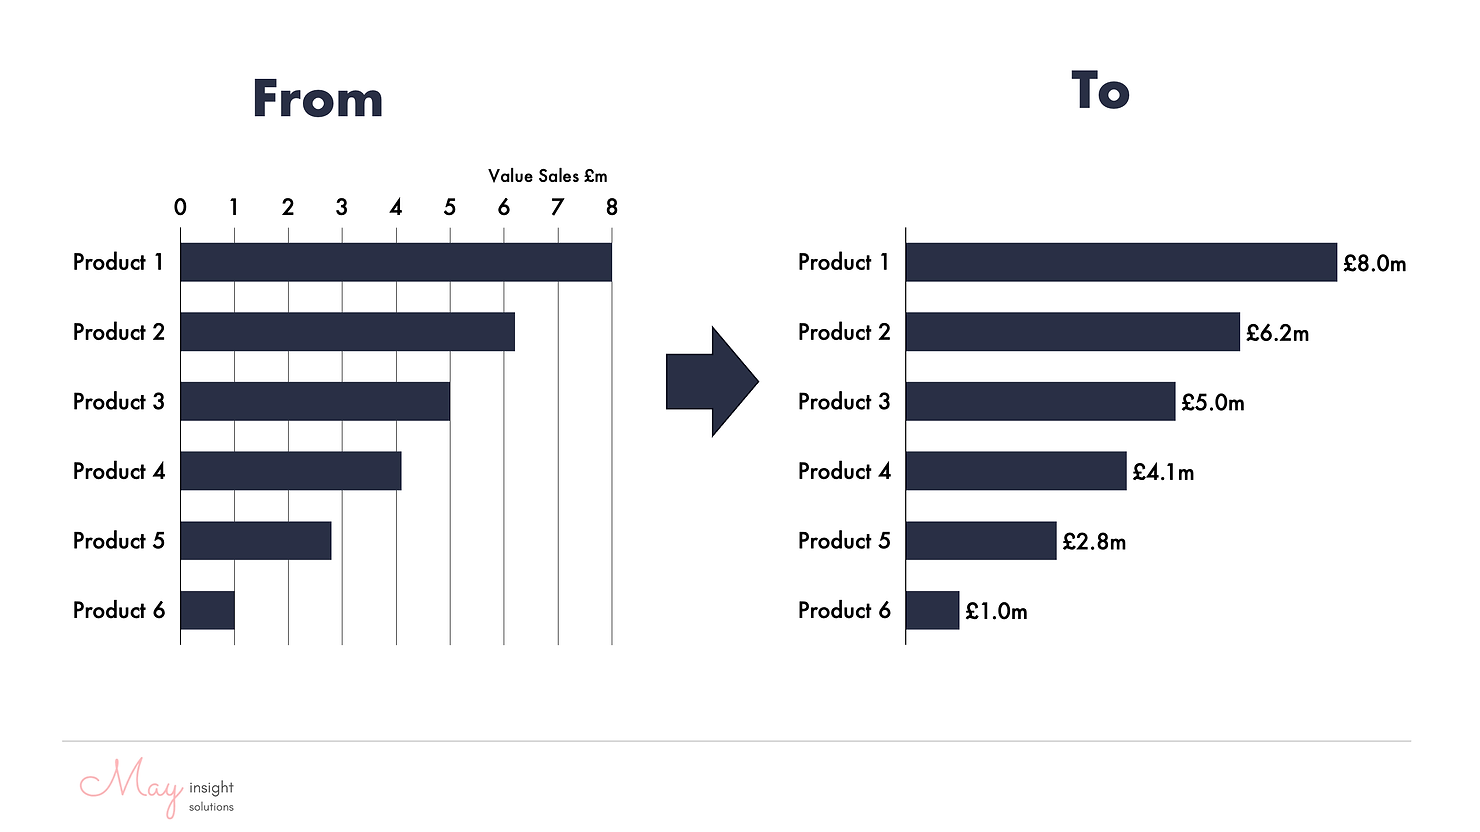
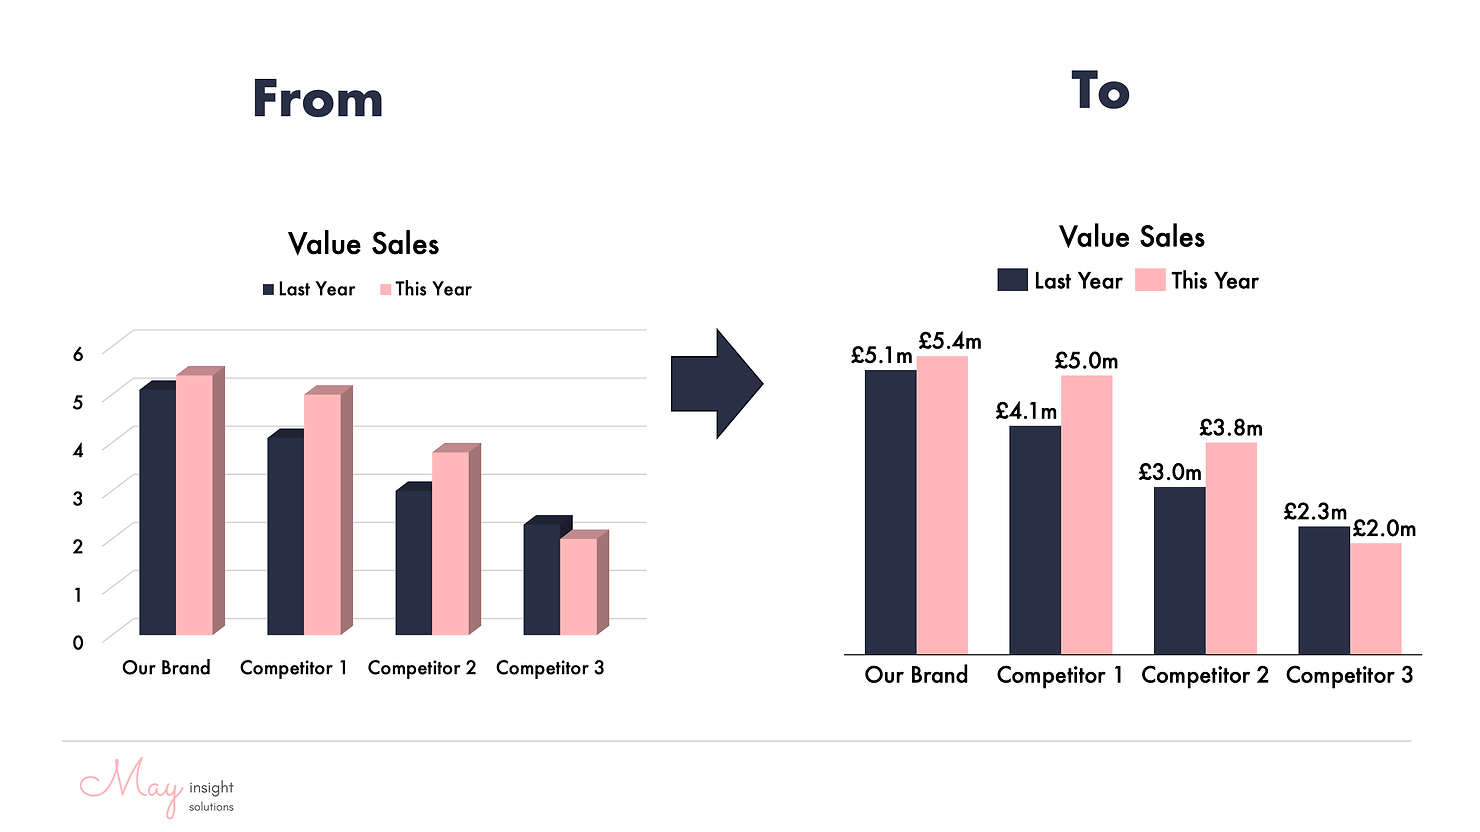
5. Make sure your data has an Axis or Labels – but avoid using both. 🏷️
You need either an axis or labels in charts to provide viewers with a reference for understanding the data. These elements help contextualise the presented information, allowing viewers to interpret the values accurately.
However, using both axes and labels simultaneously can lead to clutter and confusion in the chart. It overwhelms viewers with redundant information, making it harder to focus on the data itself.
Labels are usually better, as it requires less cognitive effort to understand the chart, but there’s a tipping point where an axis is better than too many labels.
6. Keep colours clear and consistent and use associated colours. 🎨
How you use colours in charts is important. They help people understand the data by making categories stand out.
Using the same colours throughout a presentation ensures people can quickly link colours to specific data points. This makes it simple for everyone to grasp trends or patterns.
If a certain colour is already associated with what you're visualising (for example Asda should be green, Sainsbury’s should be orange), it makes the chart more intuitive for the reader.
Choosing colours with a clear contrast also helps ensure a colour blind reader understands the data.

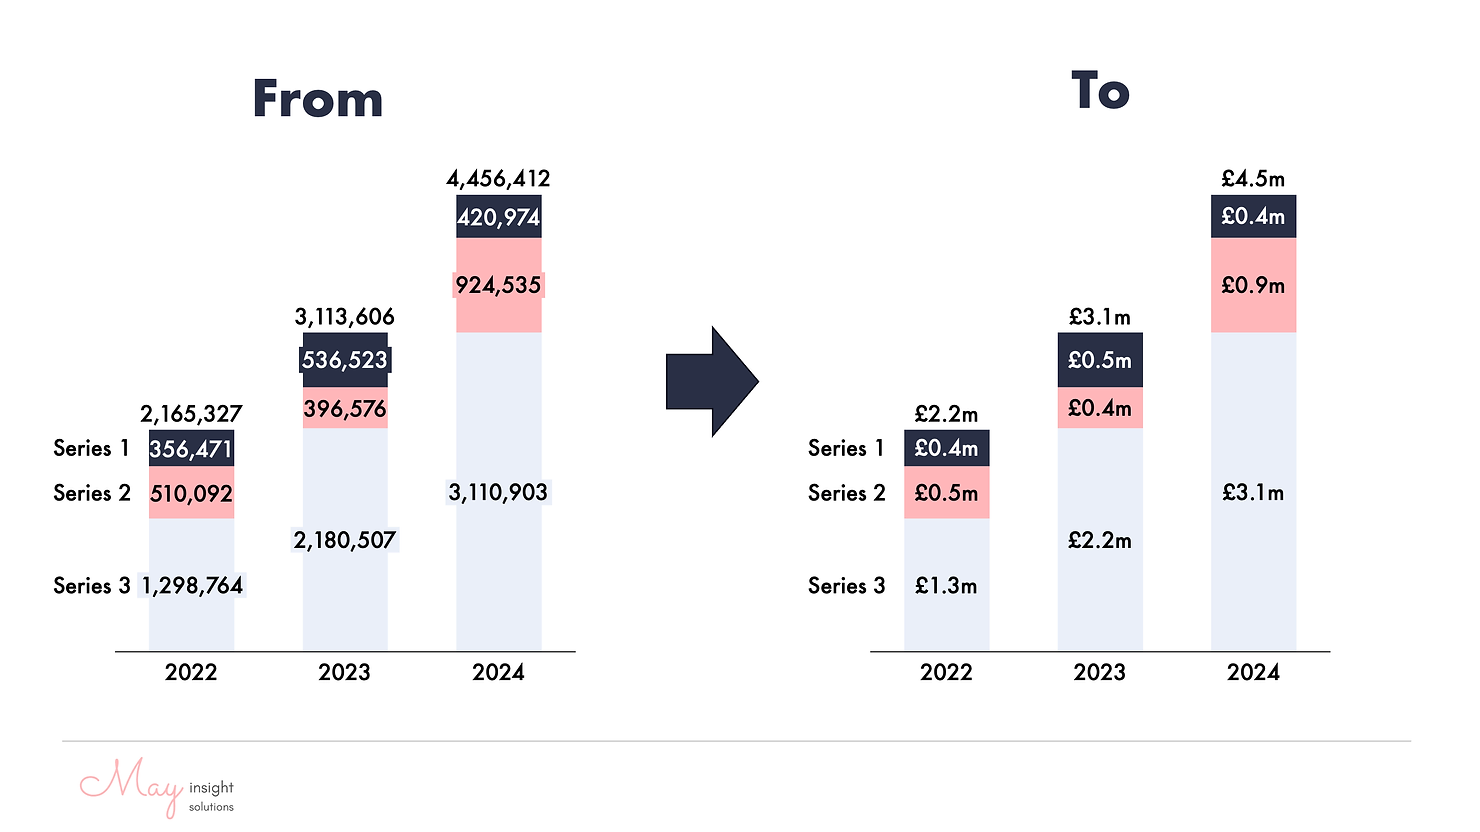
7. Format your numbers so they are clear. 🔢
When numbers are clear, it's easier for people to read and understand them. You want to make sure your formatting is consistent throughout the chart, so it's easy to compare values.
Adding symbols like currency signs or percentages helps give context to the numbers, so people know what they represent.
It’s easier for the reader to understand “£4.5m” than 4,456,412.
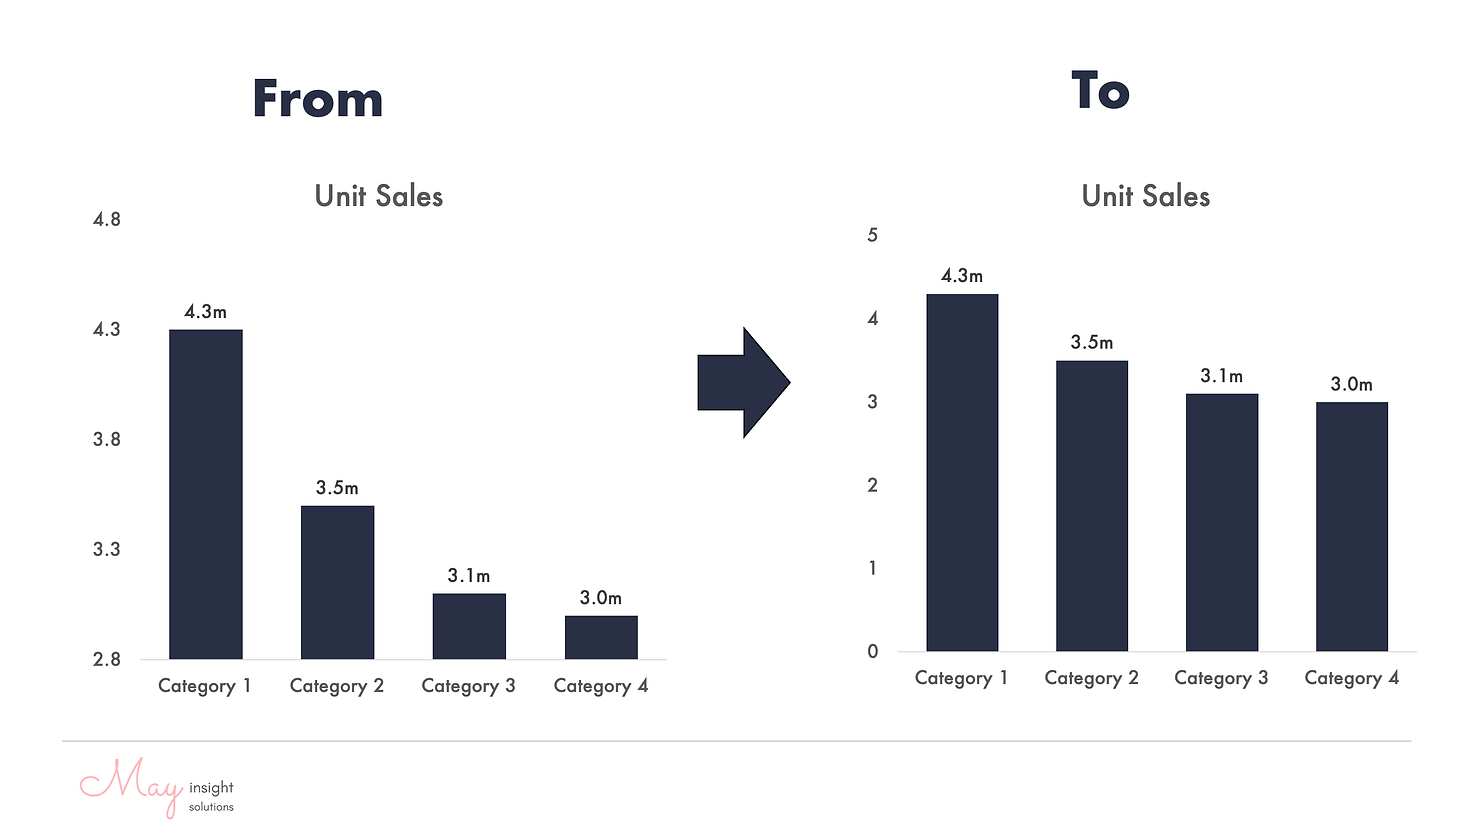
8. Use your axis honestly. 🔍
Using your axis honestly in charts is vital. It ensures accuracy and maintains the integrity of the data you're presenting.
People rely on charts to give them truthful information in a visual way, so honest axis scaling is crucial for representing your data.
When your axis scaling is transparent, it helps viewers understand the real relationship between data points. This avoids misleading visuals that could lead to wrong conclusions.
Ultimately, presenting data honestly reflects ethical standards and builds trust in your presentations.
9. Never use 3D. 👓
Beyond looking like your chart has come straight out of 1993, 3D effects can mess with how you see the data, making it hard to understand the values or compare them properly.
Over-styling your charts just adds unnecessary complications, making them harder to read. And let's not forget, that some people find 3D charts tricky to grasp, especially those with visual impairments or less experience with data.
So, keep it simple and professional by sticking to 2D charts.
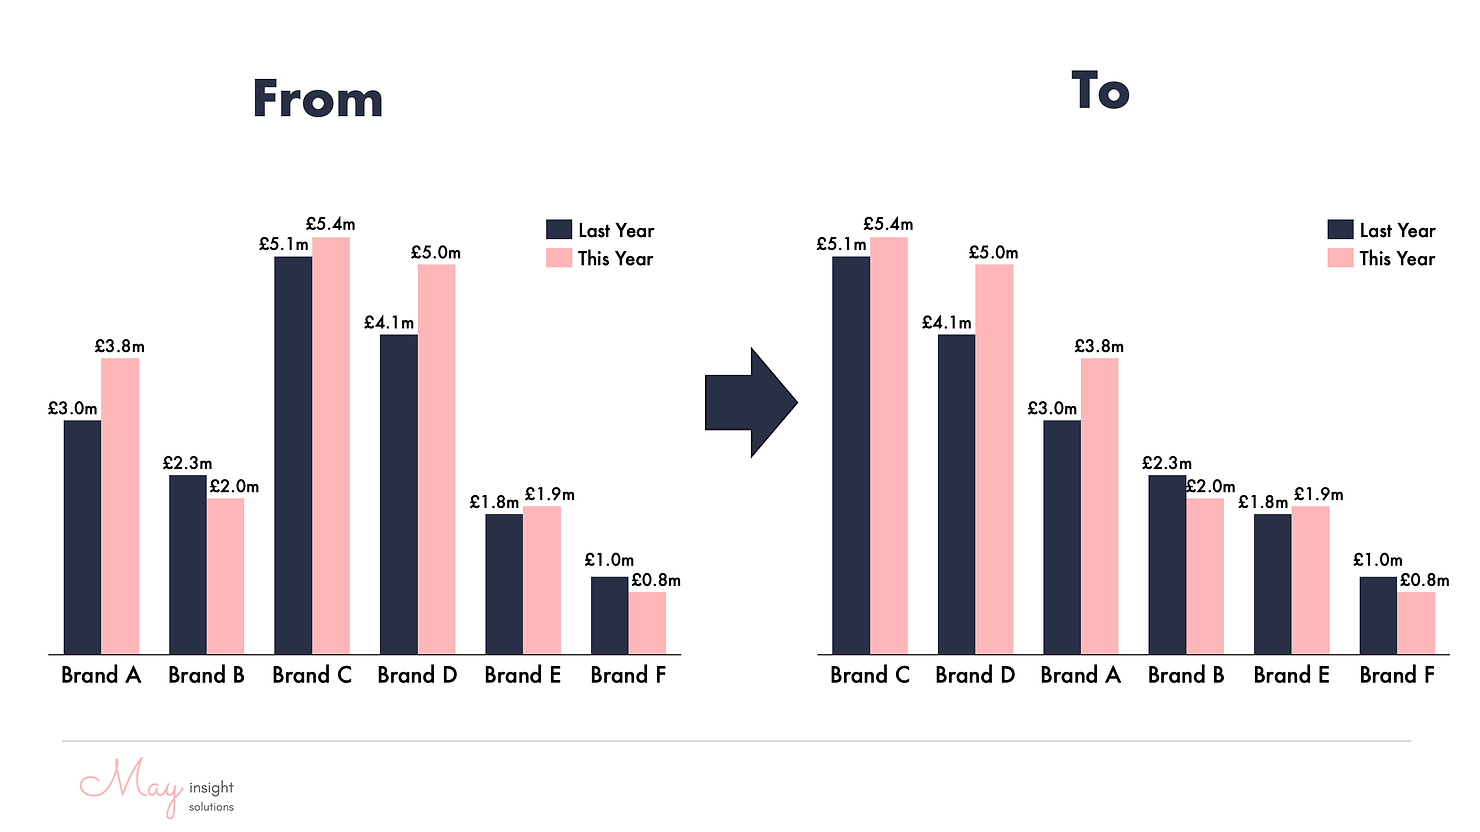
10. Read your chart - Left to right / Top to bottom. 📖
When presenting data, it's crucial to consider how people naturally read information—typically from top to bottom or left to right.
This logic can be applied in a few different ways:
Chronologically, data should be represented earliest to latest to show movement left to right (or top to bottom).
Sorting categories from largest to smallest often makes the data easier to understand, and highlights the most significant data points.
In other situations, placing the most important data at the top or left side of the chart ensures it catches viewers' attention first.
This approach maximizes the impact of your data presentation, ensuring that key insights are easily and quickly communicated to your audience.
So, there we have it. My golden rules to make your charts easy to understand.
Did I miss anything? I’d love to hear your top tips for visualising data.
My team and I are full of tips and tricks when it comes to presenting data, so reach out to us if there’s anything we can do to help you and your business.
Trying to upskill your team in all things Cat Man?
Check out our training courses or get in touch for a chat about how we can help.
May 2024